The rock-solid base for Receptor.AI drug discovery platform: benchmarking the drug-target interaction AI model
Announcement


Full Text
Main principles of Receptor.AI drug discovery workflow
The success of any drug discovery project depends on the quality of high-throughput virtual screening. At this stage the huge chemical space is searched for the candidate compounds, which are predicted to be active for the target protein and selective against undesired off-targets. The virtual screening has to comply with mutually exclusive criteria of being very fast and precise at the same time. The AI-based drug-target interaction models are able to achieve this goal, but their performance depends on the quality of the training dataset, model architecture and model parameters tuning.
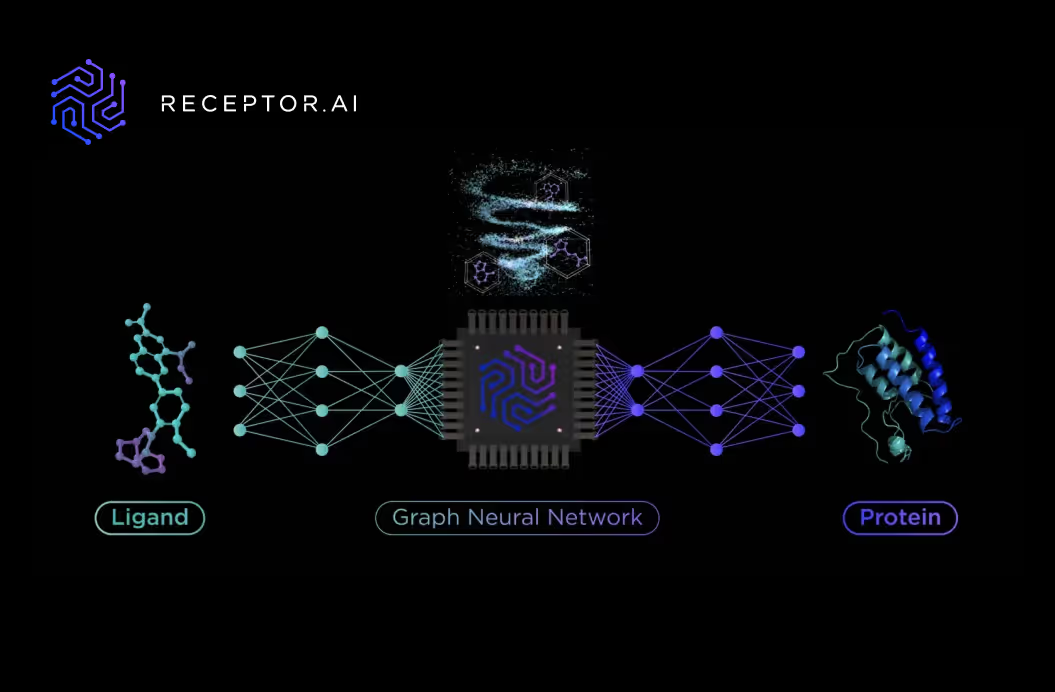
Receptor.AI small molecule drug discovery platform utilises a workflow that consists of Deep Learning techniques and AI-assisted in silico techniques for drug-target activity (DTA) prediction.
Here we present the comprehensive benchmark of the Receptor.AI DTA module, which demonstrates its excellent performance metrics.
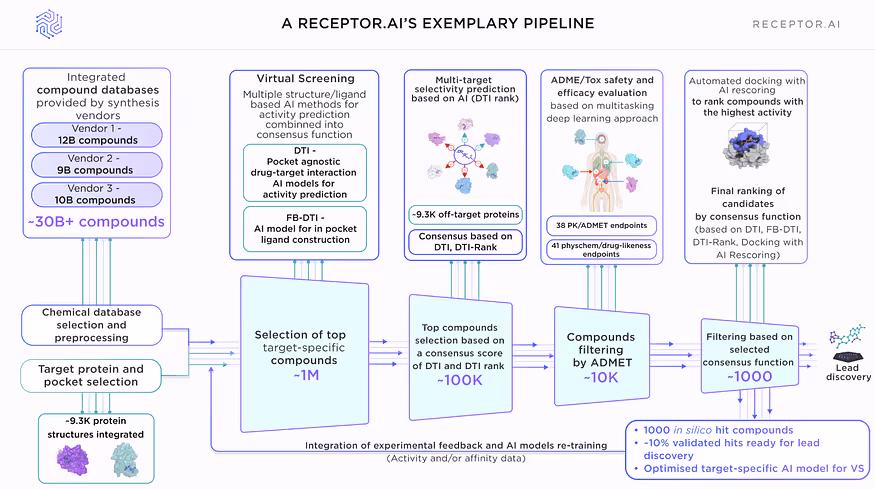
There are two separate stages in the virtual screening pipeline (Fig. 1):
- Primary screening is performed by simultaneous evaluation of the screened compounds by two AI models: the drug-target interaction (DTI) activity prediction model, which is agnostic to the binding pocket and is based on the target protein structure and its previously known ligands; and the fragment-based drug-target interaction model (FB-DTI), which evaluates the molecules against particular binding pocket but is agnostic to the structures of any previously known ligands. The results of these models are combined into a smart consensus function to balance their priority and relative weight depending on the target protein.
- Secondary screening is performed by first applying the multiparametric ADME-Tox prediction deep learning model (40+ ADME-Tox endpoints, 40 phys-chem parameters and drug-likeness metrics), followed by the molecular docking with AI rescoring.
Overview of performed tests
- DTI primary benchmark. The model was trained on the extensive in-house dataset and tested on millions of protein-ligand pairs, which were not used for training, to measure the most important performance metrics.
- DTI comparative benchmark. The model was compared to 8 other modern AI algorithms for small molecule virtual screening on two widespread benchmark datasets for molecular activity prediction.
- DTI real-world benchmark. Evaluation of the model performance on a synthetic dataset containing known active ligands of 8 widespread protein targets mixed in a large pool of inactive compounds (decoys). The quality of the active compounds retrieval and prioritisation was studied.
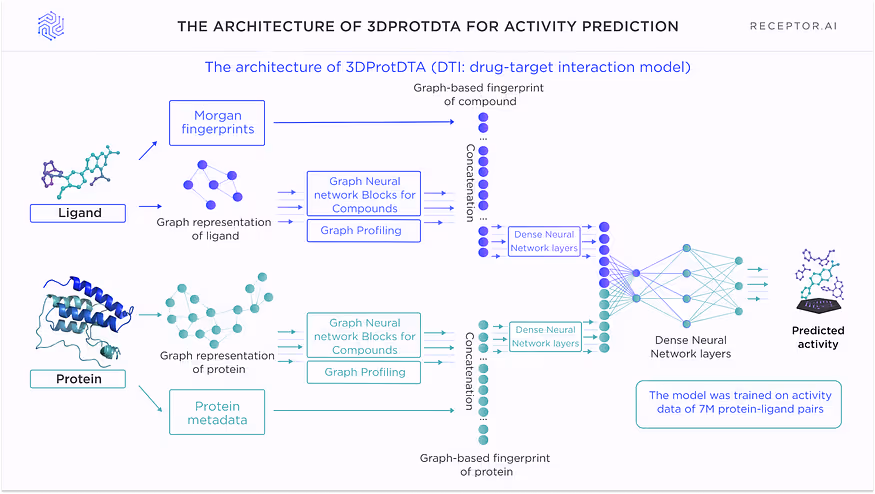
Model architecture
The architecture of the DTI model for activity prediction is shown in Fig. 2. This model incorporates knowledge about existing ligands but is agnostic to the binding pocket. It is used for proteins with at least several known ligands and is the most successful if the number of ligands is 10+. It can operate on the proteins without any experimental data about where the ligands actually bind.
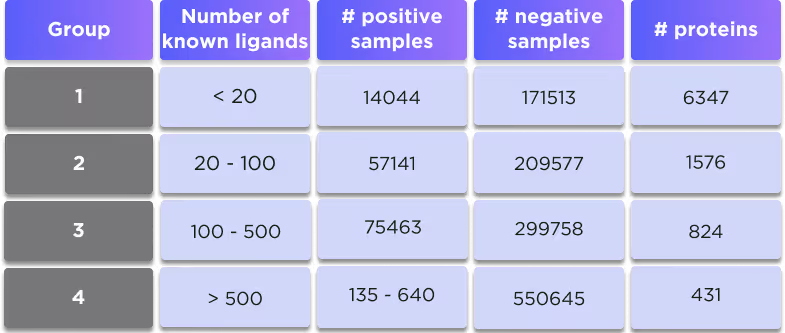
There are 4 different versions of this model, which are trained on the separate subsets of the proteome with different numbers of known ligands, which provides the balanced representation of different available ligand structures and avoids possible biassing towards the most abundant types of compounds.
Model description
DTI is a pocket-agnostic graph-based AI model for predicting the activity of ligands against the target protein. The model is trained separately on 4 different subsets of proteins depending on the number of their available ligands in the training set:
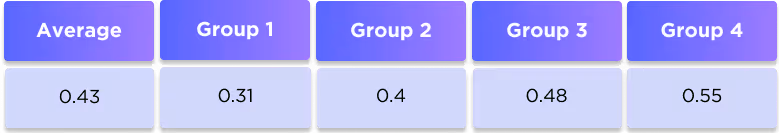
Either average performance or the performance by the group is reported below.
Training and testing datasets
The compounds from the testing datasets were explicitly removed from the training dataset. The similarity between the training and testing datasets was computed as the Tanimoto similarity coefficient based on a comparison of Morgan 2048-bit fingerprints with radius 3.
The datasets are dissimilar and thus represent a valid test of the model.
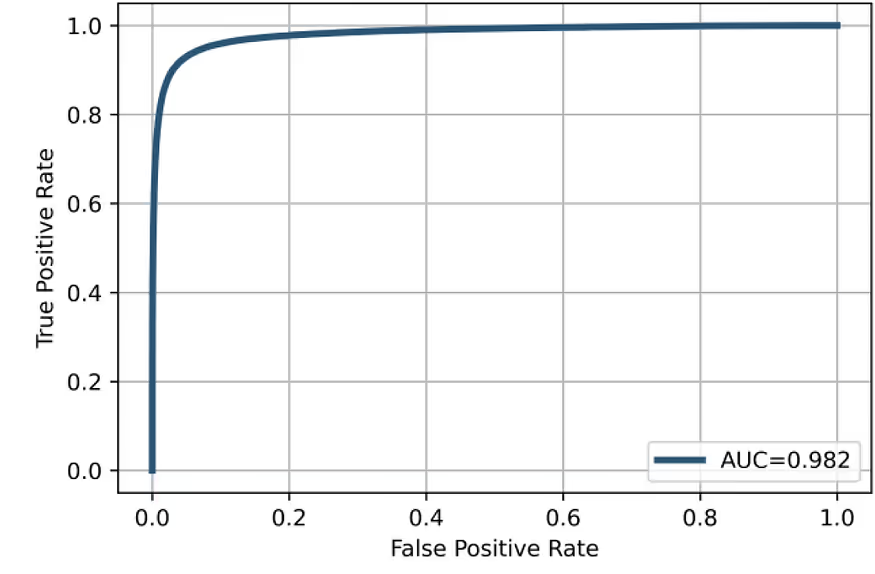
Average performance metrics
The average performance metrics show very good model performance and an excellent balance between false positives and false negatives

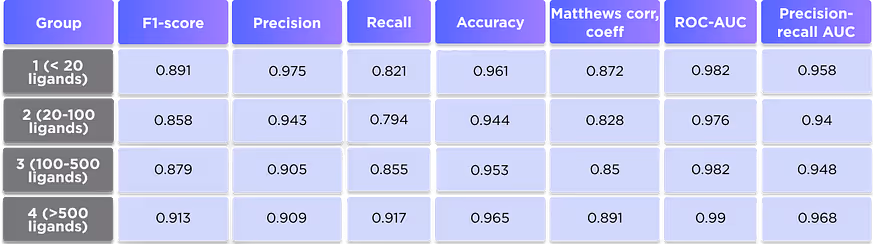
Per group performance metrics
We also computed the performance metrics separately for each of the protein groups. Although the results are slightly different, all groups demonstrate very good performance, suggesting that the model gives equally good results for the proteins with different numbers of known ligands.
Comparison of DTI to other AI approaches
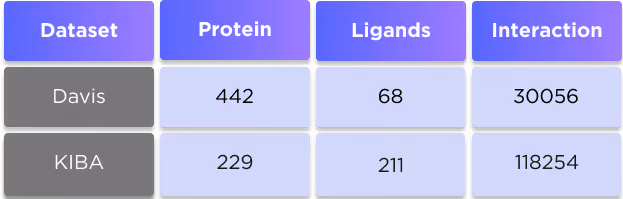
We evaluated our approach on two widespread benchmark datasets for DTA prediction: Davis (1) and KIBA (2).
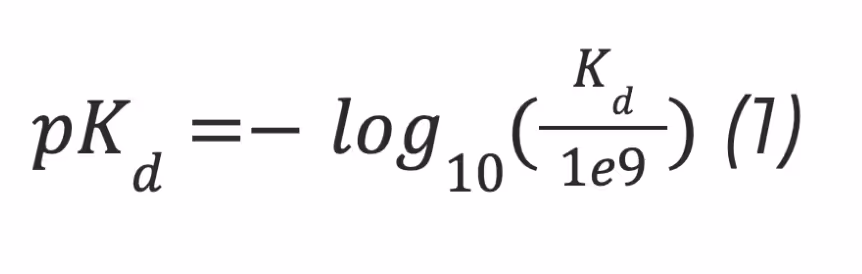
The Davis dataset contains the pairs of kinase proteins and their respective inhibitors with experimentally determined dissociation constant (Kd) values. Kd values were transformed by equation 1, and transformed scores were used as labels for benchmarking in the same way as in the baseline approaches. There are 442 proteins and 68 ligands in this dataset.
The KIBA dataset comprises scores originating from an approach called KIBA, in which inhibitor bioactivities from different sources such as Ki, Kd and IC50 are combined. The KIBA scores were pre-processed by the SimBoost algorithm (3), and the final values were used as labels for model training. Initially, the KIBA dataset contained 467 proteins and 52498 ligands. For benchmarking purposes, the same authors (3) filtered the dataset to keep only the drugs and targets with at least 10 interactions resulting in 229 unique proteins and 2111 unique ligands.
The numbers of affinity scores and unique entries in the datasets are summarised in Table 3.
We compared the results of our approach to different classical machine learning-based and deep learning-based methods, which are considered to be state-of-art at the time of writing.
Similarity-based approaches KronRLS (4) and SimBoost (3) used a similarity matrix computed using the Pubchem structure clustering server (Pubchem Sim, http://pubchem.ncbi.nlm.nih.gov) to represent ligands and the protein similarity matrix constructed with the help of Smith-Waterman algorithm to represent targets (5). KronRLS uses the regularised least-square model, while SimBoost is the gradient-boosting machine-based method.
The DeepDTA method (6) used 1D CNNs to process protein sequences and SMILES of the ligands. The GANsDTA (7) proposed a semi-supervised GANs-based method to predict binding affinity using target sequences and ligand SMILES. The same initial protein and ligand representations were used in the DeepCDA (8) method, where authors applied encoding by CNN and LSTM blocks. The GraphDTA (9) authors proposed GNNs to process ligand graphs while proteins were still encoded by CNN applied to sequences.
We selected 3 evaluation metrics used by most authors of the baseline approaches.
The mean squared error (MSE):
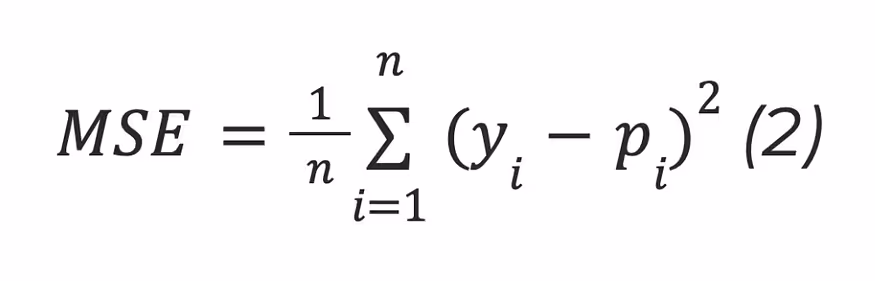
where n is the number of samples, yi is the observed value, and pi is the predicted value.
The concordance Index (CI) (10):
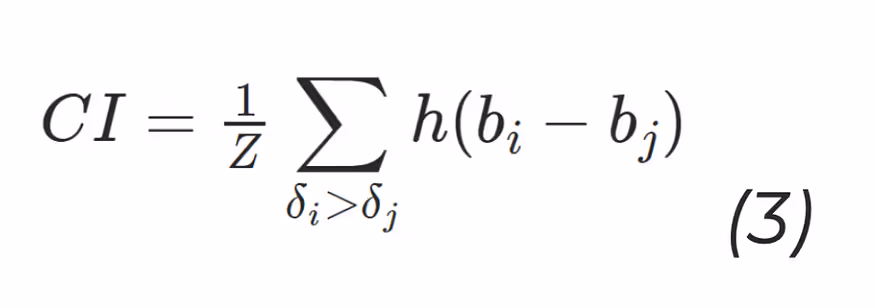
where bi is the prediction for the larger affinity δi, bj is the prediction value for the smaller affinity δj, Z is a normalisation constant, h(x) is the step function:
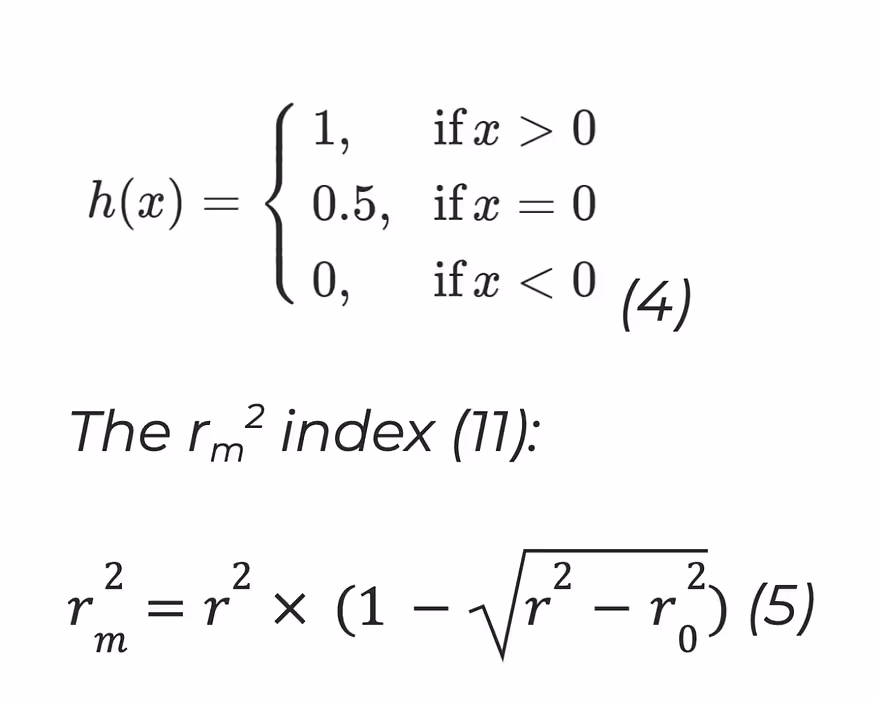
where r2 and r02 are the squared correlation coefficients with and without intercept respectively.
The results of the comparison are shown in tables 4 and 5.
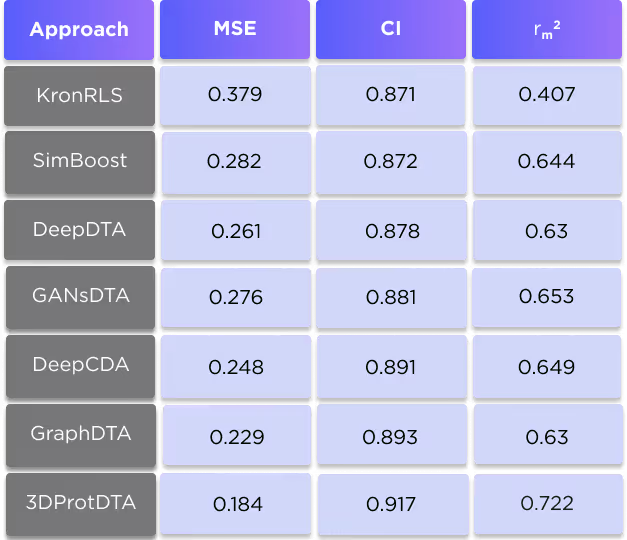
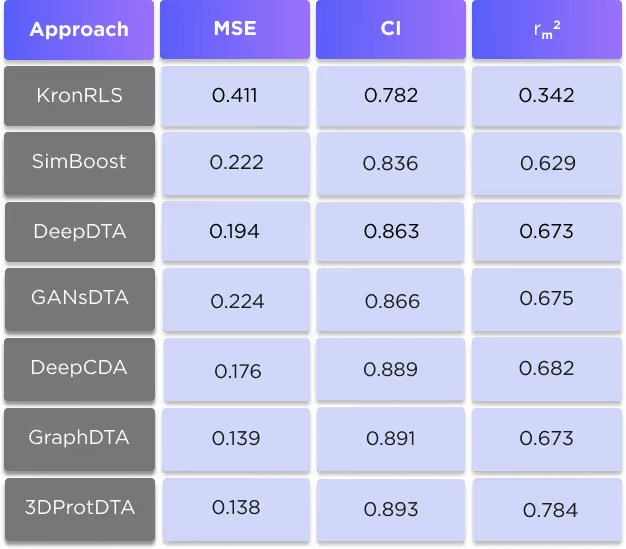
It is clearly seen that our technique is superior to all competing methods for all three used metrics. For more information about this comparison, see our preprint: https://www.biorxiv.org/content/10.1101/2022.11.24.517815v1
Recognition of known active ligands
In this benchmark, we have chosen 8 well-known proteins that are routinely used in benchmarking and comparison of the drug discovery techniques: Carbonic anhydrase II (CA2), Androgen receptor (AR), Cathepsin D (Cath-D), Beta-secretase 1 (BACE1), Janus kinase 1 (JAK1), Cyclin-dependent kinase 2 (CDK2), Matrix metallopeptidase 12 (MMP12) and Casein kinase 2 (CK2).
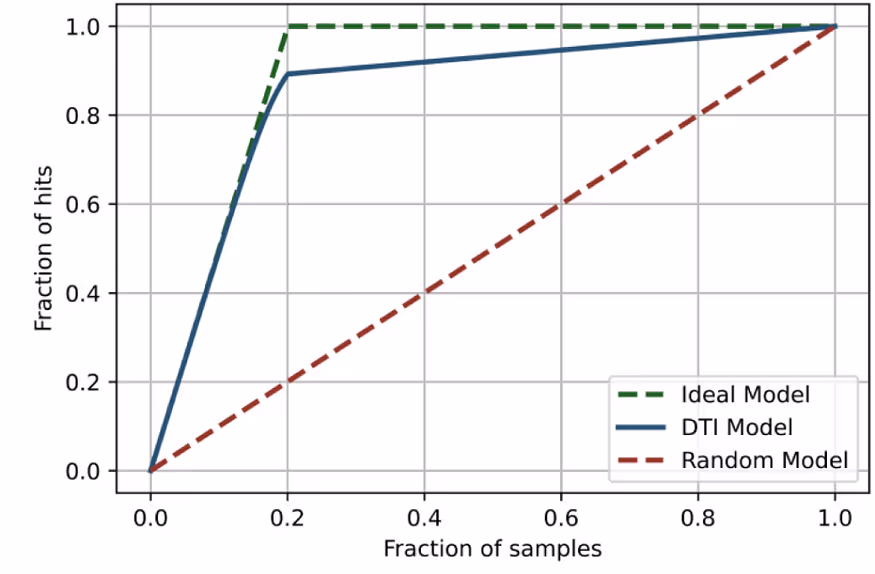
We identified known ligands of these proteins with the most reliable estimates of activity (9–16 depending on the protein) and mixed them with a large number of inactive decoys (9–32K depending on the protein). Our DTI model is then applied to the whole set of compounds and ranks them according to predicted activity. The number of known active ligands in the top 20 and top 100 ranked compounds is shown in Table 6 and visualised in Fig. 3.
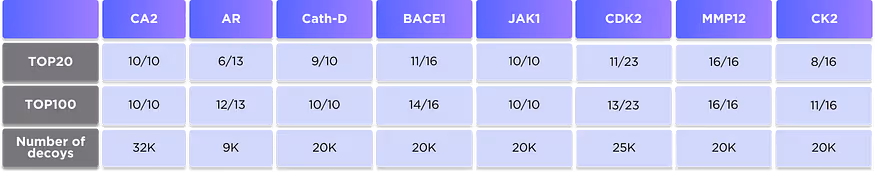
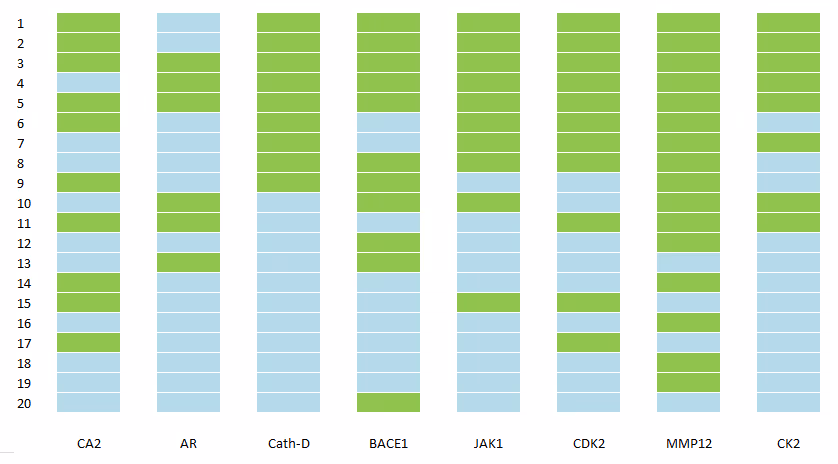
It is clearly seen that the DTI model correctly prioritises the most known ligands and places them on the very top of the ranked list for all studied proteins.
Conclusion
The drug-target interaction model developed by Receptor.AI demonstrates an excellent performance in both synthetic benchmarks and the real world performance tests. The model is currently published in the preprint and is submitted for publication to the scientific journal. In the next parts of the benchmark, 38 ADME-Tox prediction models, 5 level selectivity assessment and structure-based AI methods will be disclosed. Stay tuned!